Detect Hidden Information
in your Observational Data

Detect Hidden Information
in your Observational Data

p.a.t.t.e.r.n is a software module for Mangold INTERACT for the automated detection and analysis of patterns in your observation data.
p.a.t.t.e.r.n helps you discover patterns that you wouldn't have recognized without this sophisticated tool or only with enormous efforts.
p.a.t.t.e.r.n analyzes your data with a hierarchical agglomerative cluster algorithm to find hidden patterns at your fingertips. In this process a variety of parameters, such as ranking, duration and the relative position of values are taken into account.
Let p.a.t.t.e.r.n show you the real patterns in your data.
We have developed a highly sophisticated method to analyze behavioral data. The INTERACT add-on module p.a.t.t.e.r.n integrates algorithms which are able to discover and quantify behavioral patterns inside your observational data.
During analysis p.a.t.t.e.r.n takes several parameters into account, such as order, duration and relative position of behavioral events.
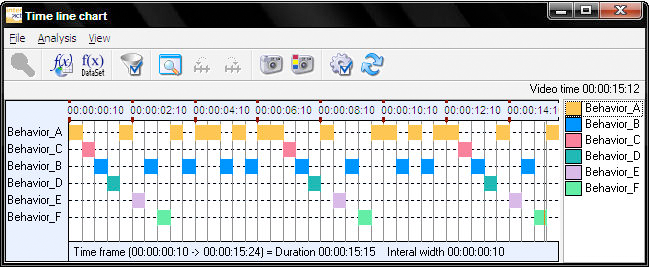
Imagine the following results of your research in form of a graphical representation on a time axis. Each line represents a certain behavior, detected throughout your observation and coding process:

It is obvious, that the given codes have to be interpreted in correlation and not each one by itself. This leads to a very complex situation, where new behavioral 'clusters' will be built from the given codes at each point in time (see the marked region in the above graph as an example).
E.g. 'Person A is talking while person B is not listening and person C is arguing against person B'. This combination of single behavioral codes ('A talking', 'B listening', 'C arguing', etc.) now forms a complex new behavior of the whole group of observed people. This is just a very simple example. Lots of other code combinations will arise in your results - and they have to be interpreted...
For easier reading we will now assign a short representation for such a complex behavior. Let's say we name the one from the above example ''A'' = 'Person A is talking while person B is not listening and person C is arguing against person B'. We assign the abbreviation ''B'' to the next different combination of codes and so on.
After that, let's list those representants one after another due to their appearance in your observational data. We will then get a ''sentence of behavioral information'' like the following: ''AHBIAJBKABAABABAAHBIAJBKAABABAAHBIAJBKA''
Can you detect the underlying pattern of behavior in the above shown data string?
No? Our add-on module can - in just a few seconds!
Two patterns of equal 'quality' can be found:

Also a HIDDEN top ordered pattern can be found:

To get those results without the support of our INTERACT product family, you would have to spend hundreds of hours with data aggregation, filtering, reorganization and statistical analysis.
With the use of p.a.t.t.e.r.n those results will be just a few mouse clicks away.